How Georgia's 2024 Elections Were Systematically Rigged – A Look at the Numbers

There is sufficient evidence to conclude that the official results of the Georgian Parliamentary election do not reflect the will of the Georgian people. The elections were systematically rigged to ensure an overwhelming majority for the ruling Georgian Dream (GD) party in the next parliament. The rigging relied on vote buying, mass intimidation, and direct electoral manipulation.
The election needs to be seen in the context of a broader capture of key state institutions, especially since 2021, that has also been reflected in downgrades of Georgia’s democracy scores across all respectable ratings efforts. In recent years, Georgia’s Freedom in the World score has declined from 64 to 58 on a 100-point scale. The Bertelsmann Transformation Index notes a decline in Georgia’s democracy scores from 6.36 in 2020 to 5.65 in 2024 on a 10-point scale and a fall from position 43 to 54 in its overall transformation rating. In recent months, the law on "transparency of foreign influence" has further constrained civic space.
This article is a shortened and adapted version of a longer policy brief that synthesized available analysis. Two colleagues currently affiliated with other organizations and institutions contributed extensively and led the statistical analysis. They bring a combined experience of more than 25 years in statistical analysis in the context of elections. Multiple people kindly contributed details, insight, and analysis to this piece, which seeks to provide critical numbers for quantification, highlight other analyses, and add statistical analysis.
Deviation from Previous Results and Trend Lines
To start with, the officially announced results of the 2024 parliamentary elections defy basic plausibility. According to official results, the Georgian Dream supposedly improved its 48.2% electoral result from 2020 to 53.9% in 2024. This means it claims to have mobilized an additional 191,942 voters, an additional 11% to their previous vote. These numbers also exceeded the GD’s 2016 results.

All credible evidence suggests that results should have gone in the opposite direction, towards a reduction of the Georgian Dream’s support. Exit polls and pre-election surveys also put the opposition parties ahead.
Multi-Pronged Assault on Free and Fair Elections
Overall, the rigging relied on bribery on an unprecedented scale, mass intimidation, and some electoral manipulation. That manipulation, in turn, drew on a purposeful undermining of the secrecy of the vote and mass surveillance at various levels. There is not necessarily a single story to the rigging as responsibility for its execution was with regional and district coordinators. Still, looking at the numbers helps to get a sense of what happened.
A critical component was that the authorities knew precisely which voters to target. Using a snowball scheme, civil servants especially were asked to report on people in their personal surroundings.
A critical component was that the authorities knew precisely which voters to target. Using a snowball scheme, civil servants especially were asked to report on people in their personal surroundings. With more than 320,000 people working in the public sector in the country, constituting about 22% of the country’s formal workforce, a few rounds of this snowball data collection provided extensive coverage across Georgia.
As it appears, the data was aggregated systematically, with the newspaper Batumelebi reporting in mid-October that Georgian Dream offices were processing the personal information of at least tens of thousands of individuals. The data seen by Batumelebi included information on health issues, drug addiction, participation in past elections, votes in past elections, and voting intention for every voter in the target region. The assumption is that at least some of that data was furnished by other state authorities without citizens’ consent.
While snowball mobilization schemes were previously used, the “bring or at least identify ten people” campaign seems to have been a core pillar of this election's mobilization effort. According to plausible accounts, these were the main targets.

Not every person in these groups will have been contacted. Still, these categories seemed to be priority targets for the Georgian Dream’s coordinators next to private sector firms aligned with the government. With this snowball scheme as a major feature, the supposed mobilization of tens of thousands of additional voters is explicable. However, the distribution across the target groups is not yet clear. Parties in other countries also try to reach voters – but consent for data use is essential, and the use of private data for purposes of coercion crosses the line towards manipulation.
Statistical Analyses Challenge Official Results
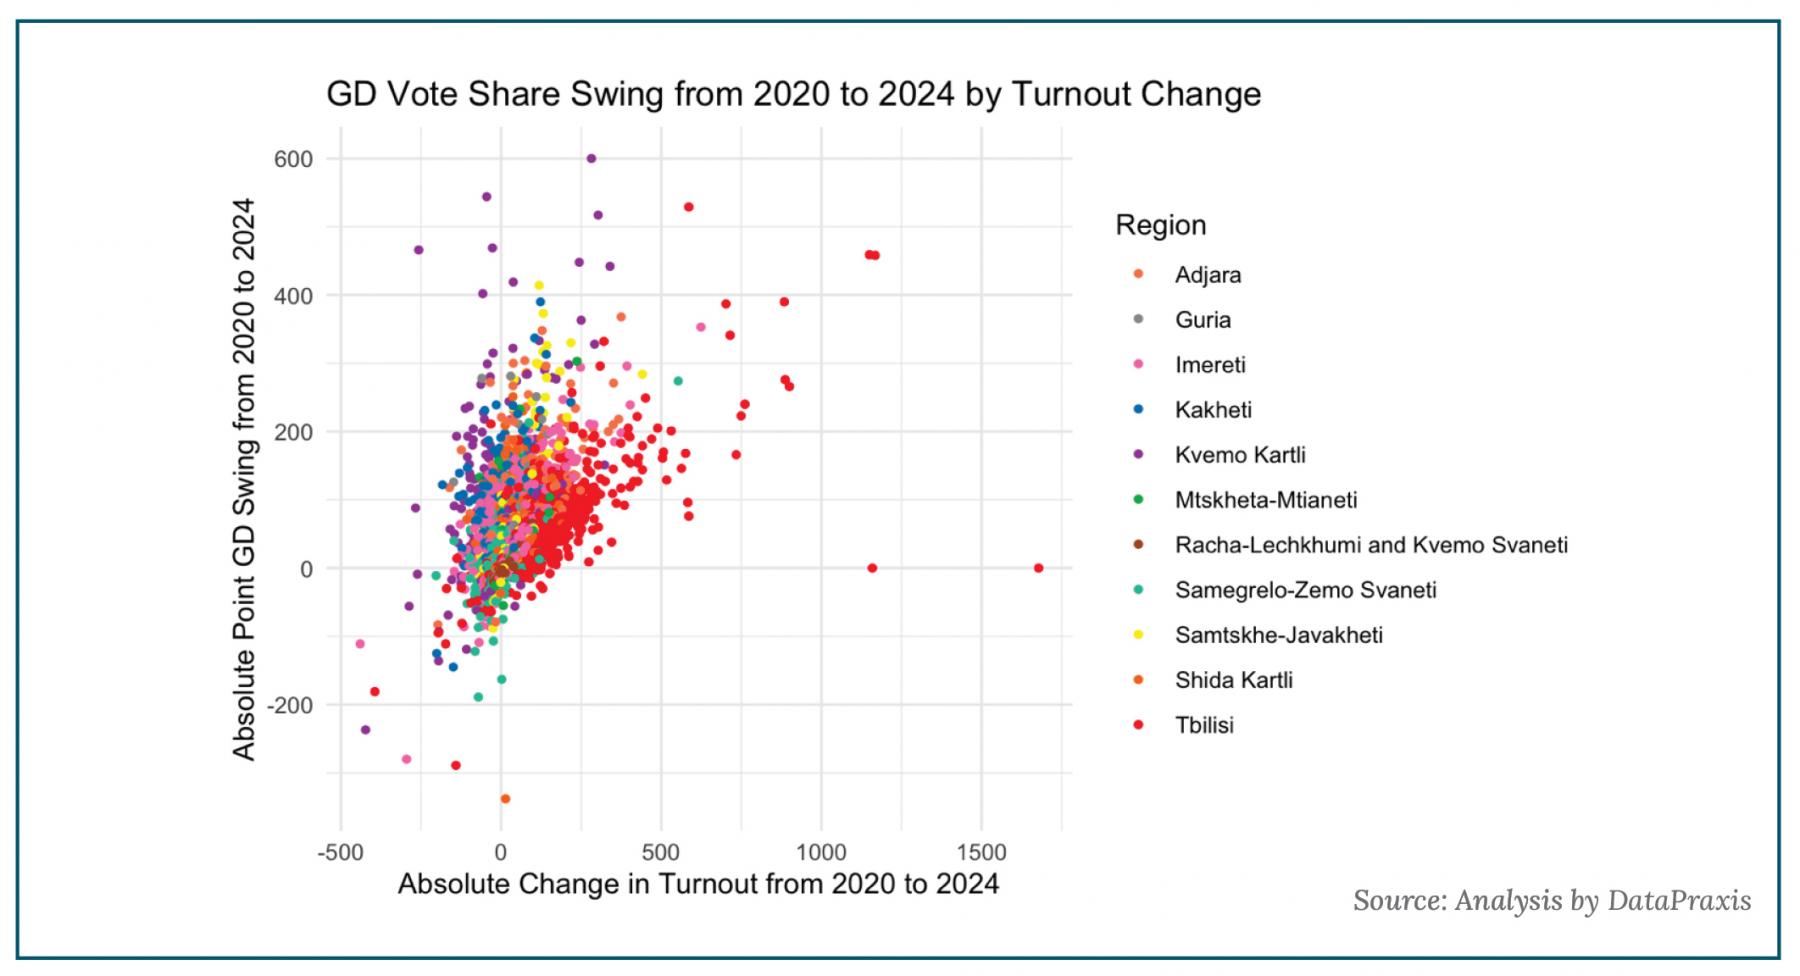
A statistical analysis conducted by Levan Kvirkvelia and Roman Udot shows that as turnout increased, there was a larger increase in the share of votes that went to the Georgian Dream.
This pattern is consistent with vote buying, intimidation, busing voters to a precinct, multiple voting, and/or other efforts that would cause anomalously high vote shares in specific precincts. No credible evidence has been provided to suggest that these results were primarily delivered through legitimate tactics such as block voting.
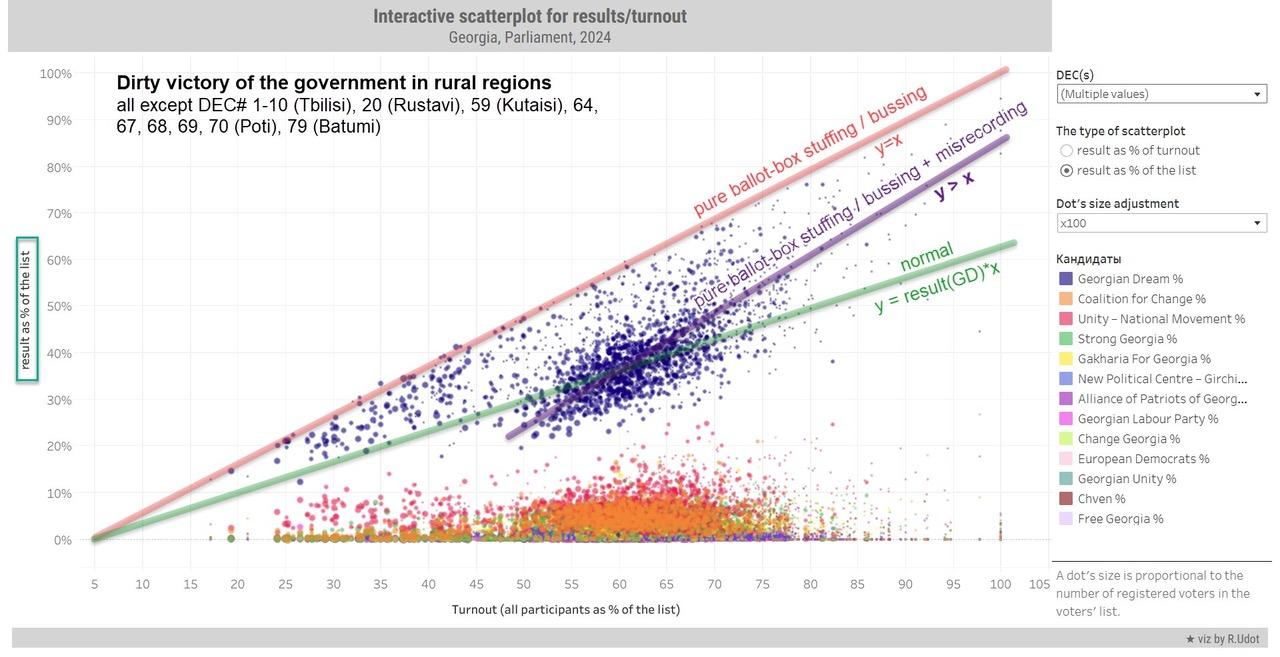
Udot’s analysis demonstrates the sharp contrast between key urban regions and other parts of Georgia.
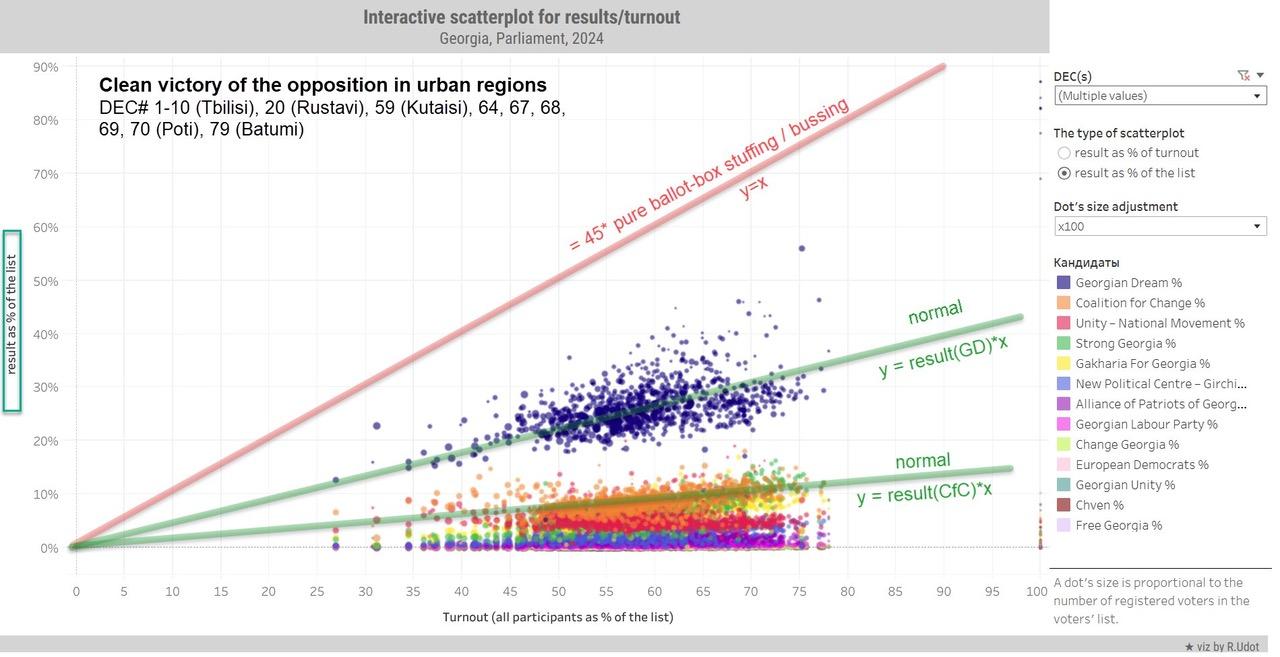
Udot: reproduced from the Insider
In some contexts, the unprecedented vote buying and mass intimidation brought many additional voters for the Georgian Dream. In others, voters massively shifted from opposition parties to the Georgian Dream. These overall trends are illustrated by the chart below.
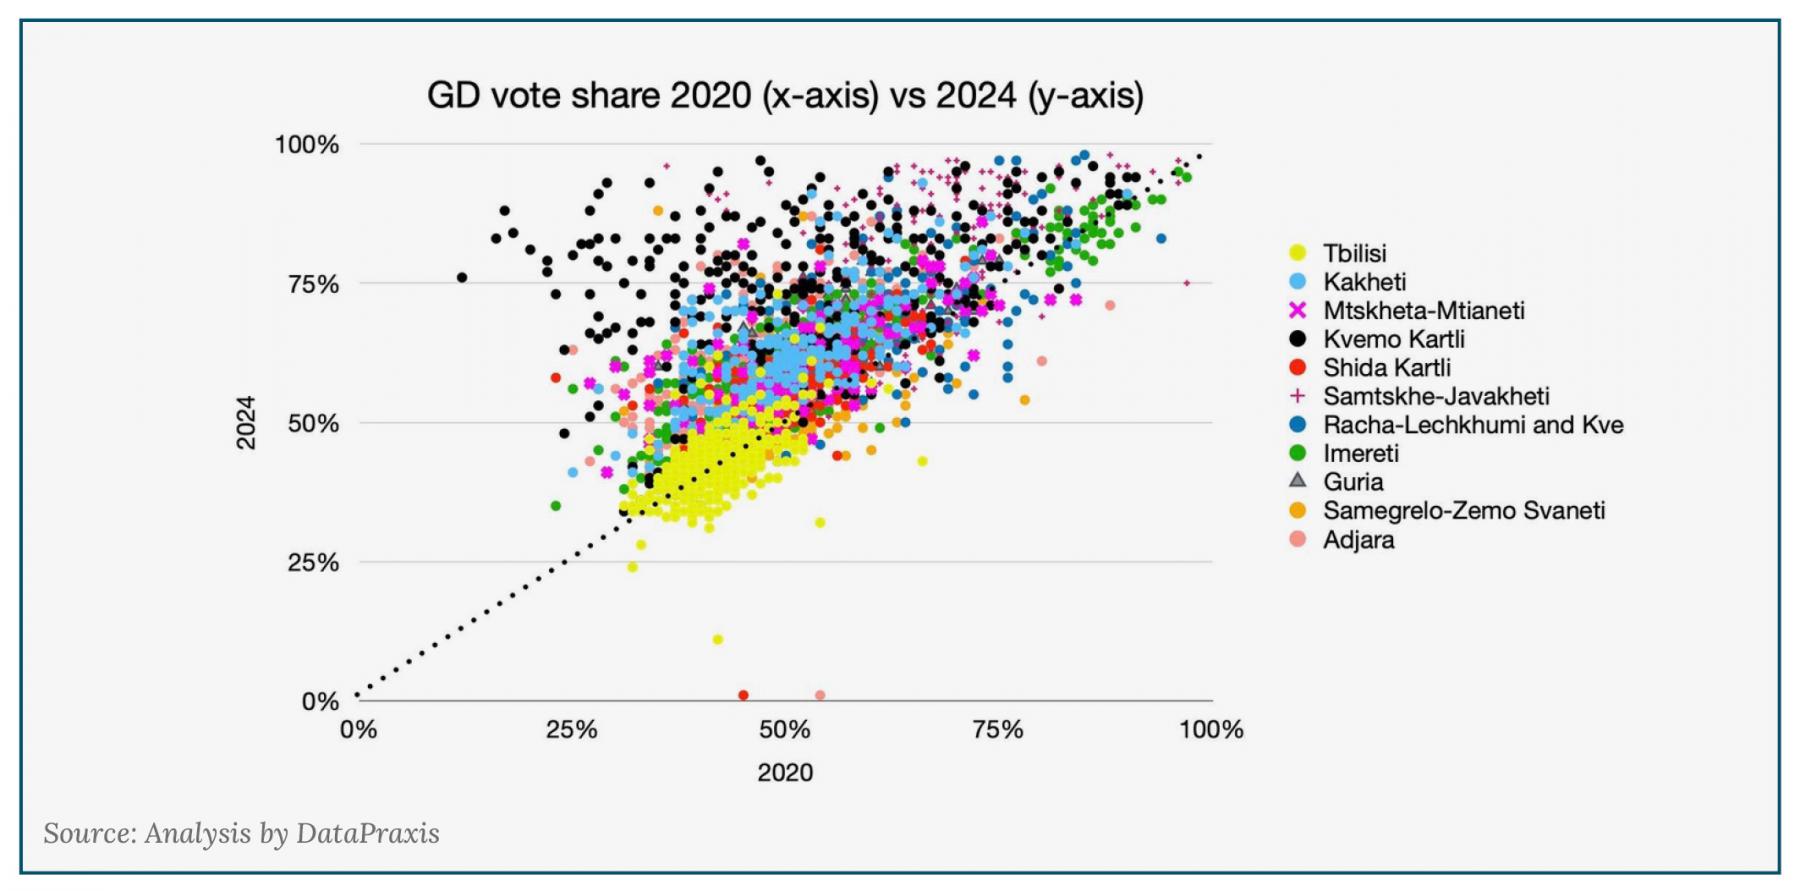
The turnout story, however, is nuanced. In some regions, turnout decreased. In large parts of Kakheti, where the main coordinator of the Georgian Dream was a feared former security official, turnout declined while support for the Georgian Dream went up, suggesting vote suppression against the opposition parties.
In other areas, turnout increased significantly, such as in Tbilisi, where support mainly was leaning to opposition parties, and in some more remote areas, where support was overwhelmingly for the Georgian Dream.
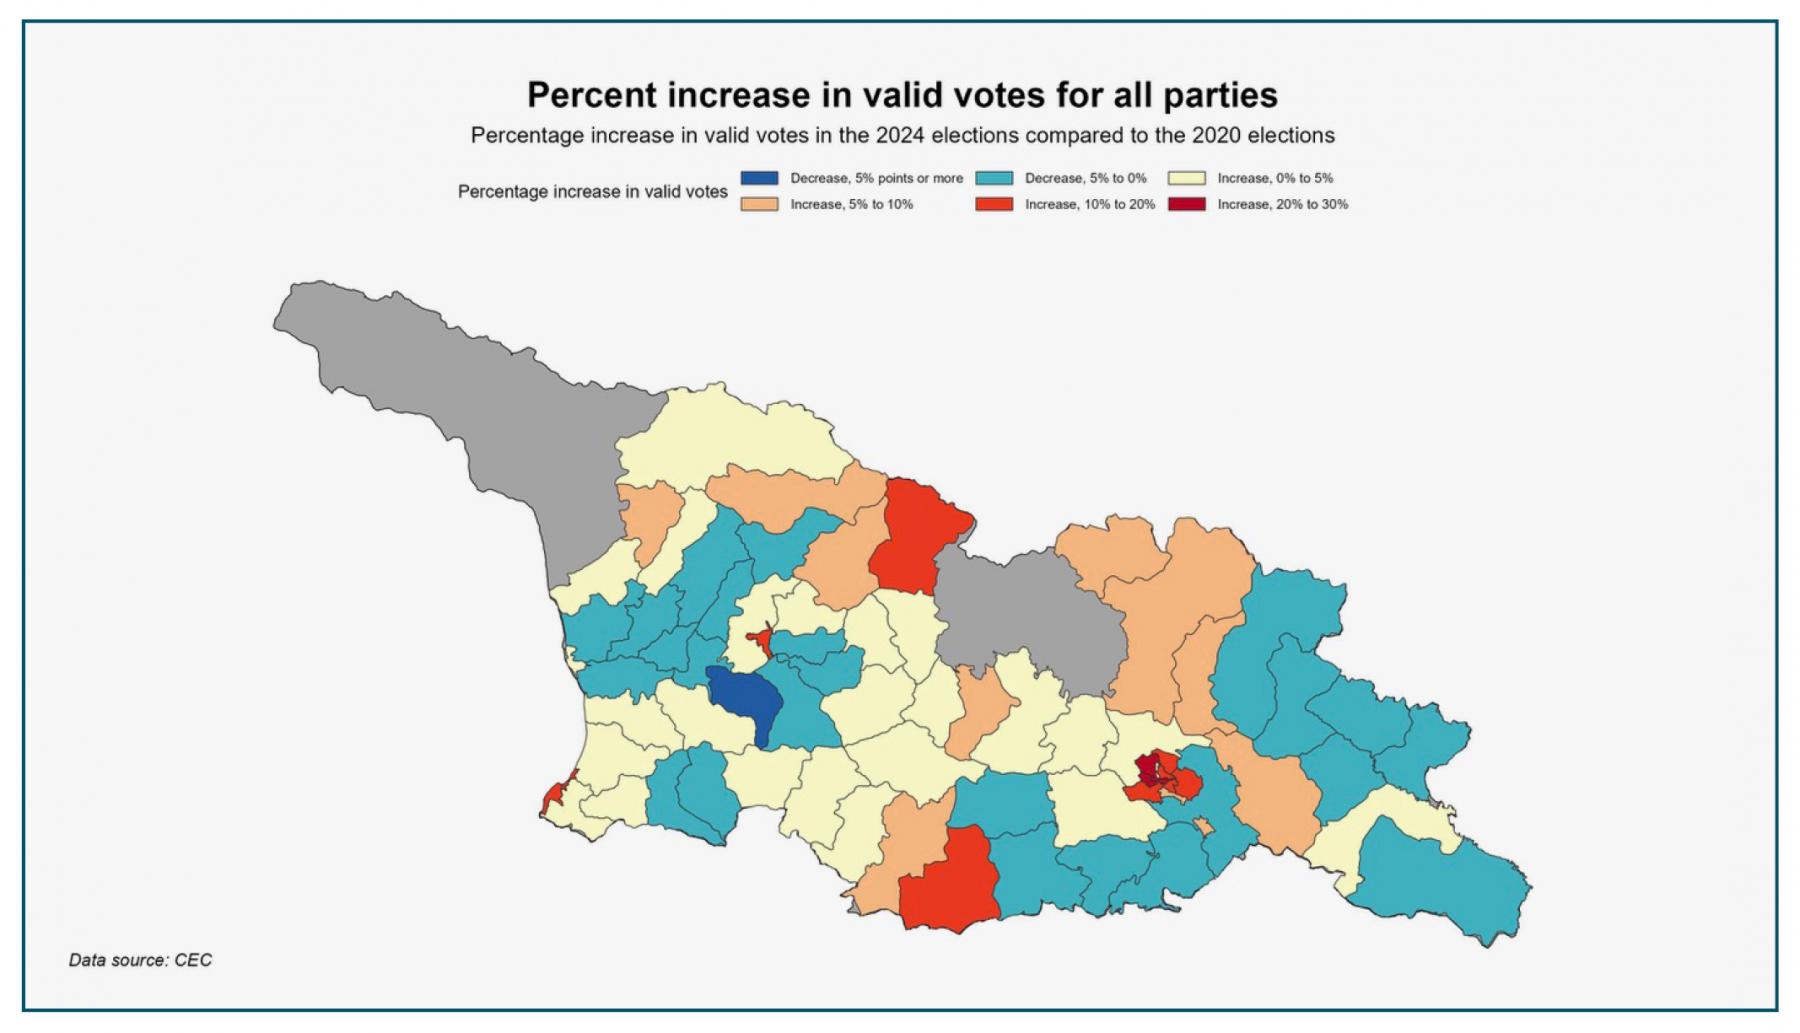
The closer analysis thus shows diverse sharp edges at work that served to undercut the competitiveness of the election.
The graph given above illustrates that no single story shows how votes switch to the GD when turnout changes. There is an overall cluster at the top left, but other data points in a different direction. This again seems to confirm that elections were managed locally at the district level.
Fingerprints on a Rigged Election
Election forensics point to consistently suspicious election results. These statistical tests look for deviations from naturally occurring patterns in data. Such deviations are akin to fingerprints left at a crime scene.
The tests specifically reported on in this section include:
1. Mean of second digit: looks at whether the second digit in a number follows Benford’s law as applied to the second rather than the first digit. This tool is commonly used in tax accounting to detect fraud, as numbers that occur under normal circumstances tend to follow this pattern, while those that have been tampered with often do not.
2. Skew: a measure of how symmetrical the distribution of turnout is. If the distribution is not symmetrical, this can imply various types of illicit voting strategies - in fairly conducted elections, the distribution of turnout tends to approximate a bell curve (or normal distribution).
3. Kurtosis: a measure of how spiky or flat a distribution is. In the current context, if the number is significantly higher than expected, it suggests a suspiciously high level of high turnout precincts.
4. Diptest: test whether there is more than one peak in the distribution of turnout. If this test suggests this is the case, it can indicate that turnout was artificially high in a set of voting precincts.
5. Zero-five percent mean (count): similar to the last digit mean test in its logic, however, it looks explicitly for excess zeros and fives which are particularly common for people to round to or for goals for party coordinators to be set at (e.g., bring 100 voters or increase the vote share to 70%). This version of the test looks at the number of votes reported.
6. Zero-five percent mean (percent): the same test as noted above; however, conducted with the percentages of votes for each party at the precinct level.
Three tests on turnout data (see the table below) show a pattern consistent with a rigged vote. The results for the Georgian Dream’s vote share show similar suspicious patterns. In total, six tests were conducted on voter turnout counts at the national level, vote counts for the Georgian Dream, and for each opposition party and/or candidate for elections since 2020 (leading to a total of 24 tests for the 2020 parliamentary elections and 24 tests for the 2024 parliamentary elections and showing that while 2020 had its problems, 2024 was a lot worse). Tests on opposition votes suggest their vote share has consistently been illicitly pushed downward.

Tests at the district level for the 2024 parliamentary elections support the widely reported suspicions of geographically concentrated electoral manipulation. The map below shows the total number of statistical anomalies registered for turnout and party vote counts.
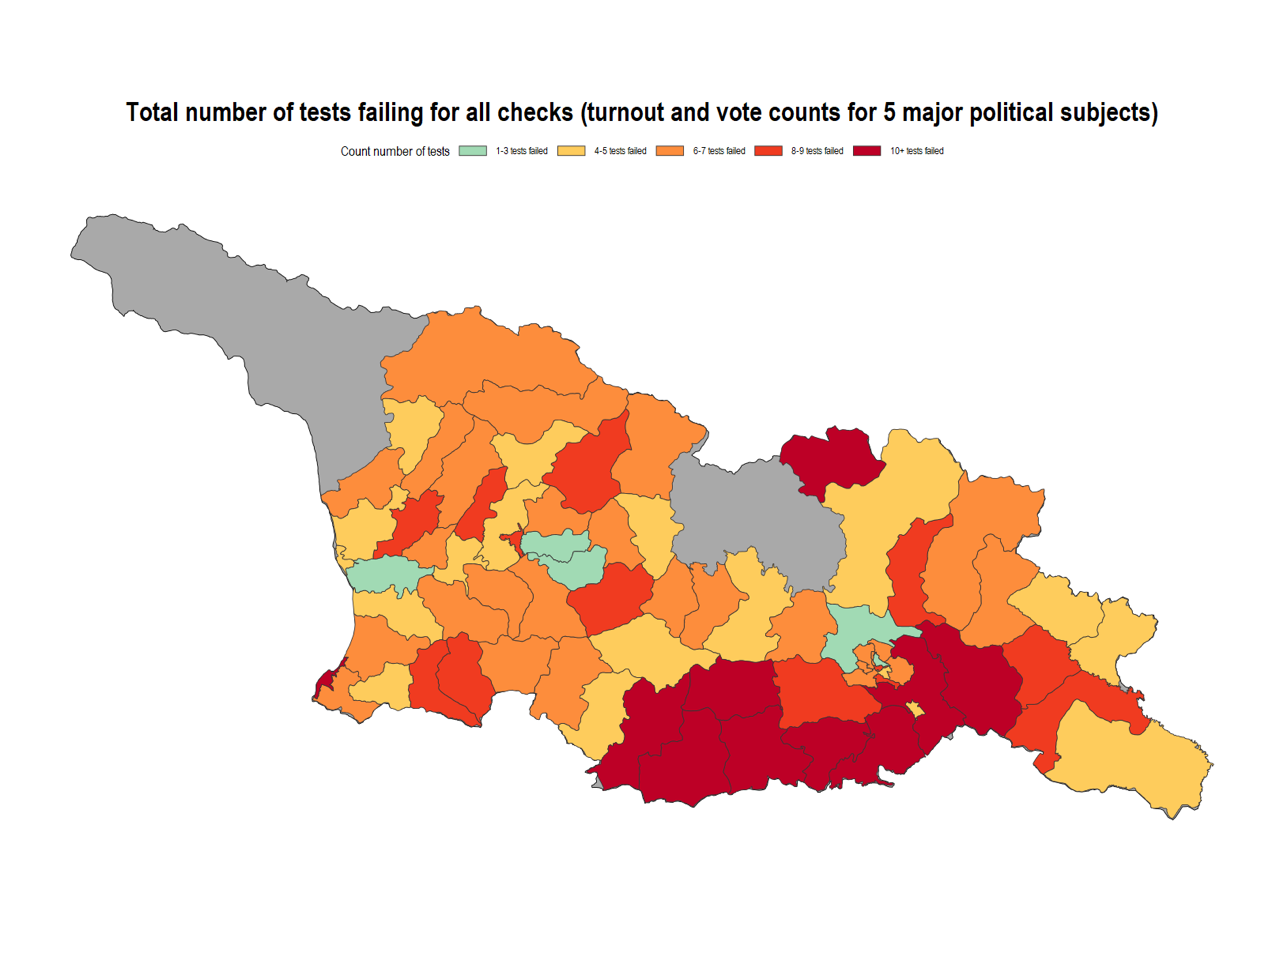
Electoral districts in the southern Kvemo Kartli and Samtskhe-Javakheti regions show ten or more anomalous results as do Sagarejo, Stepantsminda, and Batumi. Dmanisi in the Kvemo Kartli region has the highest number of flags, indicating 15 deviations from normal statistical behavior.
These techniques can also be used to analyze previous elections in Georgia and show some negative patterns during United National Movement (UNM) rule, highlighting that these are not just tools that work in one side’s favor.
Sharp Impacts at the Precinct Level
The analysis above shows that the election was rigged. Further statistical exploration shows that violations on election day alone could have affected tens or hundreds of thousands of votes. This conclusion results from comparing similar locations where observers did and did not report issues using a statistical tool called matching.
Matching enables an estimate at the precinct level of the minimum impacts on the Georgian Dream and opposition vote counts from specific forms of electoral malfeasance such as violence and intimidation, violations of voter secrecy, and obstruction of voters on election day. To conduct this analysis, we used data from the CEC, Geostat - Georgia’s National Statistics Agency, geospatial data, and WeVote observer reports of election violations to identify statistically indistinguishable locations that did and did not have observer reports of issues. With regression, we estimated the impact at the precinct level. Matching was conducted on precincts with any named violation in the WeVote category and then analysis of individual violation types was conducted to decompose the impact.
In precincts where observers reported physical violence and intimidation, the Georgian Dream gained an additional 30 votes while the main four opposition parties lost 41 votes. That is to say, violence worked.
The analysis shows a remarkable picture. In precincts where observers reported physical violence and intimidation, the Georgian Dream gained an additional 30 votes while the main four opposition parties lost 41 votes. That is to say, violence worked: In precincts where it was employed, the Georgian Dream intimidated and, on average, beat 71 votes out of voters. Because observers were not in every location, it is not possible to determine how large an effect fear had on election day overall.
If intimidation and a credible threat of imminent violence occurred at 100 precincts, the Georgian Dream received 7,100 votes. If voters were actively terrified at 500 precincts, the ruling party received 35,500 extra votes. Importantly, this number should be considered a floor—intimidation in Georgia was widespread before election day and this number only accounts for fear on election day.
Observers also widely reported the breach of secrecy of the vote. In precincts where this was observed, the opposition lost an additional 53 votes due to this practice. If this practice was a problem at 24% of precincts, as reported by the ODIHR observers, the lack of secrecy gave the Georgian Dream an advantage of 39,538 votes. If this problem prevailed at more than 2,200 precincts with electronic vote counting devices, as widely reported, this number could approach 116,600 votes. As mentioned, the ODIHR observed difficulties feeding the ballot into the vote-counting devices in more than half of the polling stations.
In precincts with restricted observer rights, the Georgian Dream gained an additional 20 votes while the opposition lost 24 votes. If this occurred in approximately 10% of polling stations, it would translate to 13,640 votes; if it occurred in 30% of polling stations, it would translate to 40,920 votes.
In addition to these bleak findings, the analysis showed that the Georgian Dream gained votes from the following practices:
- Violations related to the mobile ballot box gave the Georgian Dream 50 votes per precinct;
- Falsification or improper correction of final protocol (a rare violation) led to the Georgian Dream having 329 votes more on average.
The main four opposition parties also lost votes in precincts that experienced the following violations:
- Campaigning at the polling station, a practice which borders on intimidation in many cases, is associated with 57 votes fewer per precinct for the main four opposition parties;
- Not checking voter ID or using safeguard methods is associated with 49 votes fewer per precinct;
- Unauthorized people at the polling station caused there to be 42 votes fewer for the four main opposition parties at each precinct this took place at, on average;
- Voting with improper documentation is associated with 32 votes fewer for the opposition per precinct where this was observed.
While based on solid statistical calculations, these results underestimate the impact of the various forms of electoral malpractice witnessed during election day. Observed vote buying was not present in the data, meaning that the impact of a widely reported violation could not be estimated. Other observers discovered vote buying in more than 10% of precincts, though the practice is illegal and, therefore, usually hidden.
Here, only statistically significant effects are presented; generally, most violations point towards advantages to the GD and disadvantages to the main four opposition parties. Had the non-significant values been given, the size of the impacts would have been substantially larger.
Finally, this analysis can only explain practices on election day itself. Pre-election day intimidation and vote buying, among other practices, account for many of the Georgian Dream’s votes and the opposition’s lack of them.
Burden of Proof on Authorities
The evidence that these elections were rigged through a multi-pronged assault – a dozen daggers – is solid. Rather than investigate these concerns, the government has gone chiefly after people who have highlighted significant discrepances.
The evidence that these elections were rigged through a multi-pronged assault – a dozen daggers – is solid. Rather than investigate these concerns, the government has gone chiefly after people who have highlighted significant discrepances. Some people continue to demand “incontrovertible proof” that the election was rigged. That reverses the actual obligations.
When a government captures the court system, it also incurs the obligation to prove that other processes in the country are free, fair, and competitive because it has taken over the one institution in which these issues otherwise can be freely negotiated – and to which citizens can come forward without fear of retribution.
In this way, the Georgian government’s response has only served to underline its overall authoritarian intent and practice.
